

Squad churn: how recognisable will each team be this season?
Tracking the minutes lost by every Premier League and EFL team over the summer

With Euro 2024 now done and dusted, it felt like a good time to revisit another one of my favourite pre-season visualisations.
I’ve been tracking how much each Premier League and EFL squad has changed since last season, based on the share of their 2023-24 league minutes accumulated by players who have departed.
For each team this is summarised in a donut chart like the example below. Each segment represents an individual player’s minutes from last season, with the size proportional to how much they played. The faded-out segments indicate who has since left the club and the number in the middle is the percentage of last season’s minutes racked up by those who are still there.
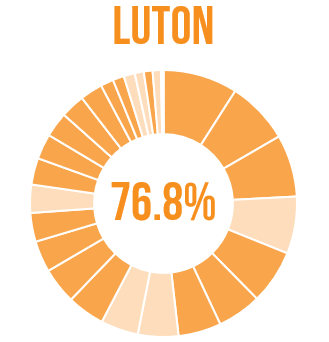
In this example, Luton have lost their 4th most-used player from last season (Ross Barkley, who was sold to Aston Villa).
Below I’ve created versions for all 92 clubs, split by division and listed in descending order of how many minutes they’ve retained so far this summer. With deals being done every day this is a moving target, so I’ll be refreshing the graphics further down the line.
Premier League
There hasn’t been a lot of movement here so far. While the English top flight is the biggest engine powering the transfer market, there’s relatively little squad movement and most clubs tend to hang on to at least 80% of the previous season’s minutes.
As Michael Cox pointed out, the top clubs’ financial clout doesn’t only manifest itself in the fees they can afford to pay; it also gives them more power to retain their existing players. While we rarely witness a dramatic squad makeover at this level, as we move down the divisions you’ll see that the average share of minutes retained drops noticeably.

Over half of the clubs in the top flight still have their most-used XI intact and only two will be without their most-fielded player. Wolves have sold Max Kilman to West Ham, while promoted Ipswich have released goalkeeper Václav Hladký.
There are currently only two Premier League teams who have lost three of their most-used XI from last season: Fulham and Southampton. The Saints could yet jump back up the rankings if their efforts to re-sign loanee Flynn Downes prove successful.
Championship
Moving down to the second tier we can already see a lot more movement taking place.
Relegated Sheffield United are having a big old clear-out, keeping six of their seven most-used players but purging those lower down the pecking order. Hull are currently the only team in the Championship who have lost more than half of last season’s minutes and this is likely to increase if Jaden Philogene departs as expected.

Sunderland and West Brom are the only two out of the 72 EFL teams who haven’t already lost at least one of last season’s most-used XI.
League One
The bottom two tiers of the EFL have already seen a lot of squad churn, with Reading the only club in the lower 48 who still retain the services of their 10 most-used players from 2023-24.

The promoted teams are taking very different approaches, with Mansfield and Wrexham keeping their squads largely intact while Crawley have opted for wholesale changes.
Rotherham are an interesting case: despite only three teams losing more minutes they’ve kept seven of their nine most-used players from last season. Like the Blades in the division above, it’s the less-utilised members of the squad who have been cut loose following relegation.
League Two
I’ve never seen a clear-out of the magnitude that’s happening at Morecambe, with their financial troubles surely to blame. Over 90% of their league minutes last season were racked up by players who have now left the club, including all of their 16 most-used squad members.

Chesterfield and Bromley appear to be keeping faith in the players that got them out of the National League. Their only first-team regulars to have departed so far have been loanees.
Despite their relegation, Port Vale have opted to hang onto all but one of their 12 most-used players from last season.
The data
I’ve compiled the data myself from a combination of retained lists, Transfermarkt, Wikipedia and the BBC, so hopefully I haven’t missed anything. It’s all sitting in this Google Sheet if you wanted to take a look – please let me know if you spot anything that looks wrong.
Next steps
I’ll create a definitive version of this once the window closes, and in the meantime I’ll use Notes to flag any interesting stuff that happens. If there’s time I’ll look at some other leagues too.