

League table footprints: 2024-25
How long teams spent in each position this season

While I’m on a bit of a posting spree, I thought I’d chuck in another vintage post-season analysis for good measure.
This is one of the simplest to create from a data perspective: I’ve calculated the league table at the end of each day, from the date of the first game to the last.
Teams are listed in their final positions down the side of the table, with each row showing how many days they ended in each position. The idea is to create a “footprint” of each team over the course of the season.
Premier League
Starting with the top flight, champions Liverpool only spent seven weeks below top spot and only two days outside the top four.
The only other teams besides Man City to top the table were Man Utd (who won the sole opening day fixture) and Brighton (who overtook them the following day thanks to a 3-0 win).
Poor Southampton only spent the first 15 days of their campaign outside the relegation zone and sat exclusively 20th from early November onwards.
The only day that Everton finished in the top half of the table was opening day on alphabetical order; otherwise their final ranking was their highest of the season.
Meanwhile Tottenham ended in the lowest position they occupied all season, progressively slipping downwards from February onwards.
Arsenal were the only team not to end a single day in the bottom half of the table, while Wolves and Southampton never sat in the top half.
Championship
Moving to the second tier, Sunderland’s elevation via the playoffs meant that the three promoted teams were the ones who had spent the most time at the top of the table. The final top four all ended up in their most common places during the season.
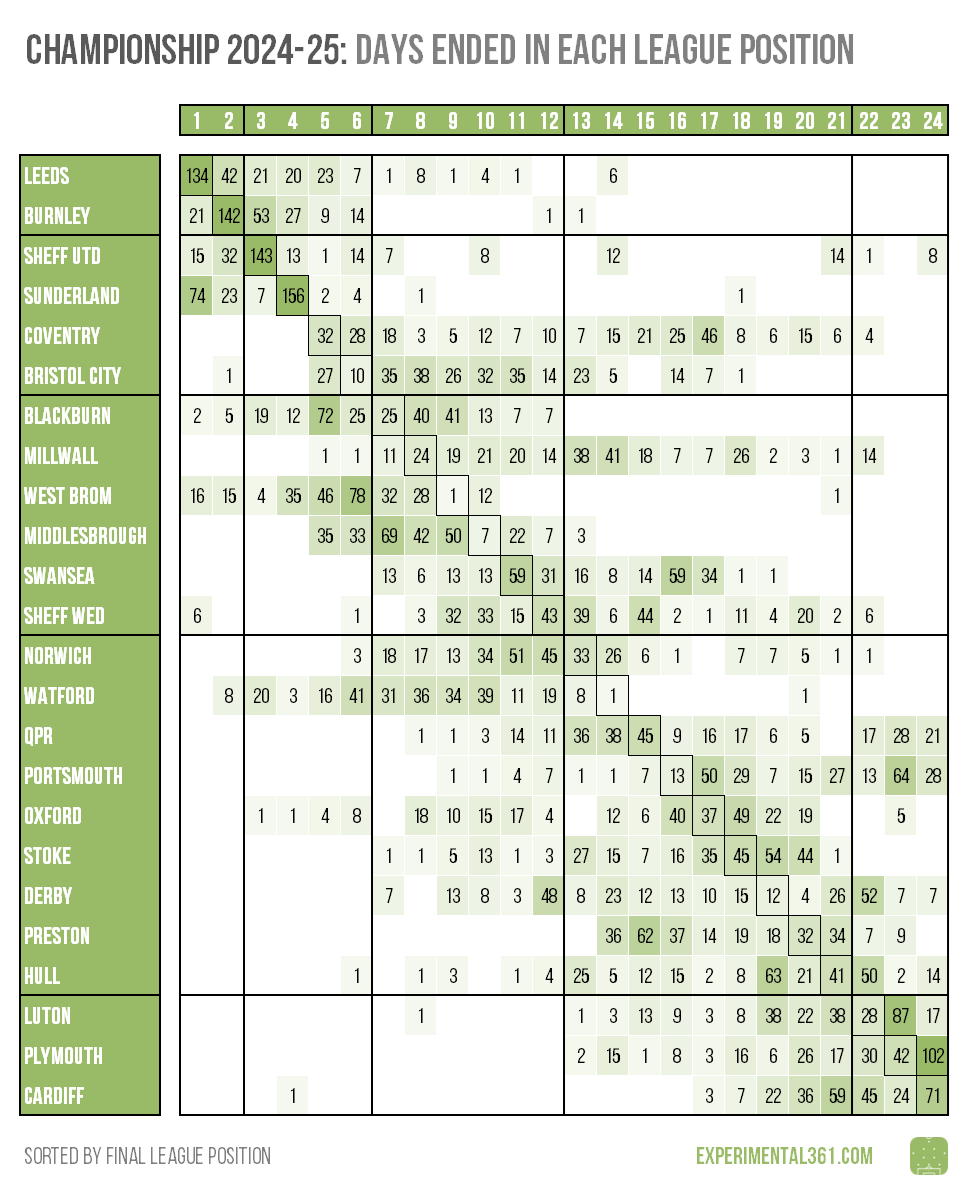
Watford finished in the bottom half of the table despite not setting foot in it until mid-February - when they dipped their toe into 13th for a day - and the final week of the season.
Coventry had the opposite trajectory: they ended their campaign in the highest position they occupied, securing a playoff spot despite having dropped into the relegation zone in late October and not leaving the bottom half until January.
Blackburn were the only team never to finish a day in the bottom half of the table, which is where both Plymouth and Preston sat exclusively during the season.
League One
In the third tier it was a frustrating season for Wycombe, who spent more time in the top two than Wrexham but ultimately missed out on promotion.
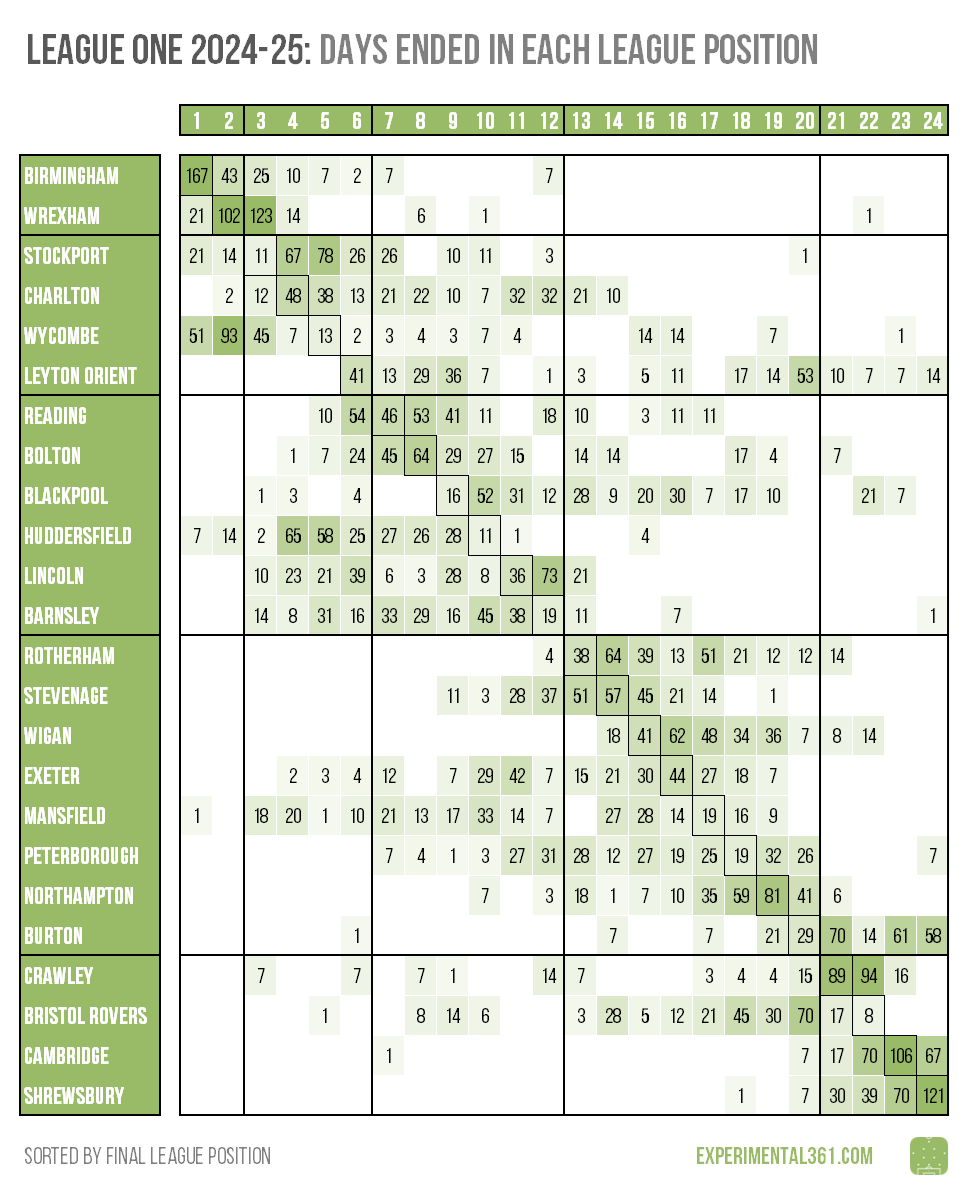
Bristol Rovers’ relegation probably stings a little bit more given how little time they spent in the danger zone: only 25 days in total. Leyton Orient languished there for almost two additional weeks yet ended up in the playoffs.
It was also a disappointing campaign for Huddersfield, who finished 10th despite spending almost two-thirds of it in the top six (they were there until late March).
Champions Birmingham were the only side never to end a day in the bottom half of the table, while Shrewsbury and Wigan both failed to reach the top half at any point.
League Two
Poor Walsall spent half the season in top spot - including an unbroken 119-day stretch from early December to early April - yet finished outside the top three.
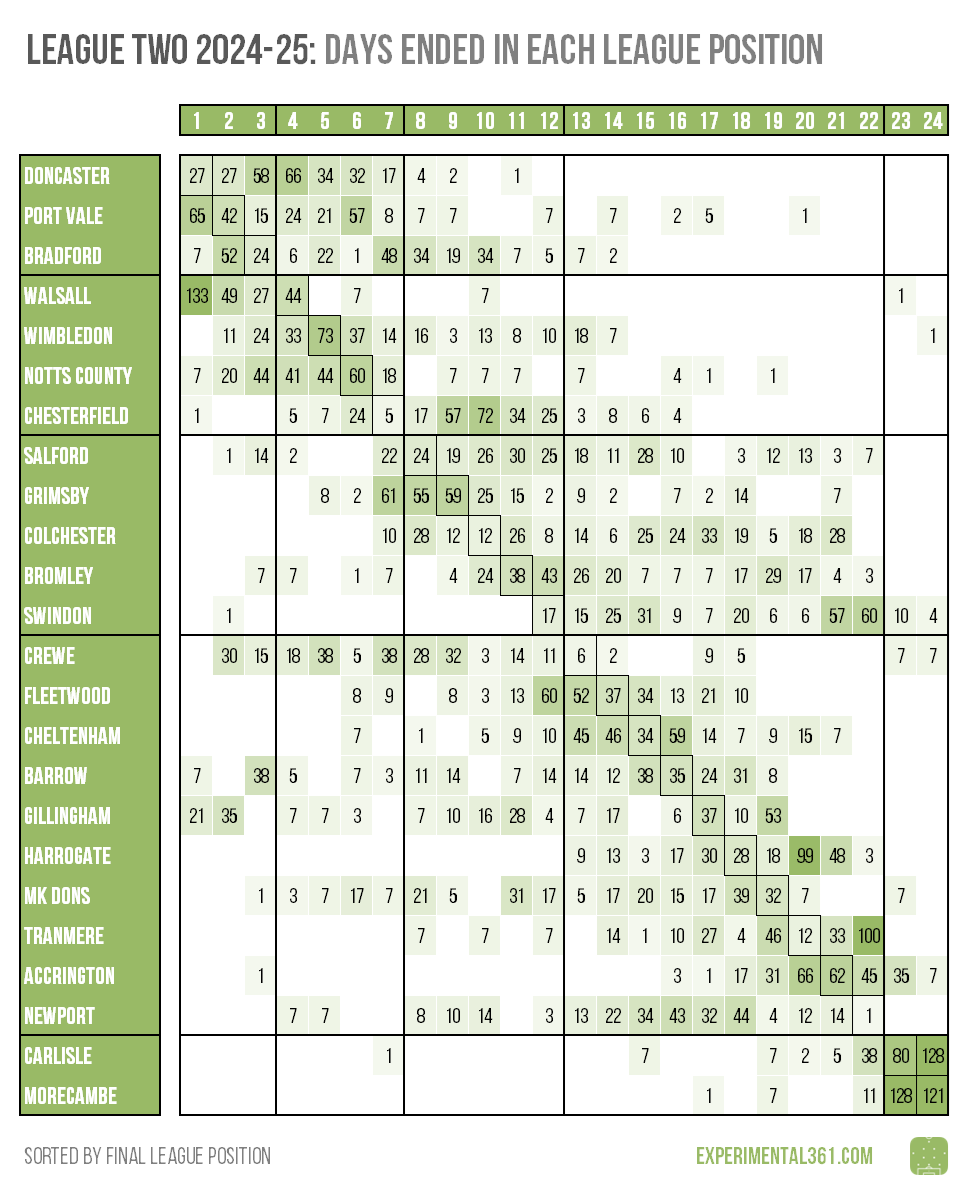
After sitting second on opening day (after drawing the only game), Swindon didn’t set foot in the top half of the table again until mid-April. They went on to finish there despite spending over four months parked perilously close to the relegation places.
Despite a season of poor performance, Newport didn’t drop to their final position of 22nd until the last day and were sat in the relative comfort of 18th only two weeks earlier.
In keeping with the pattern established by the three higher divisions, there was only one team who never set foot in the bottom half of the table (champions Doncaster) and two (Harrogate and Morecambe) who didn’t finish a day in the top half.